
A predictable outcome is one of the most sought-after goals in any business or initiative. It’s easy to see why.
We often correlate predictability with attractive benefits like lower risk, higher business value, and maybe even less stress. So with every new project, we dutifully gather time, effort, and resource estimates from all involved — hoping that this time we’ll nail it.
Except we rarely do.
Fact-Based Predictability with Lean Metrics
Predictability metrics help teams make more accurate estimates about the completion and consistency of their work items. This can lead to better work prioritization and more targeted communications among stakeholders.
"Wenn Sie Entscheidungen auf der Grundlage von Fakten statt auf der Grundlage von Prognosen treffen können, erhalten Sie Ergebnisse, die besser vorhersehbar sind. Lean Development ist die Kunst und Disziplin, Verpflichtungen auf Fakten statt auf Prognosen zu stützen."
— Mary Poppendieck, Lean Development and the Predictability Paradox (2003)
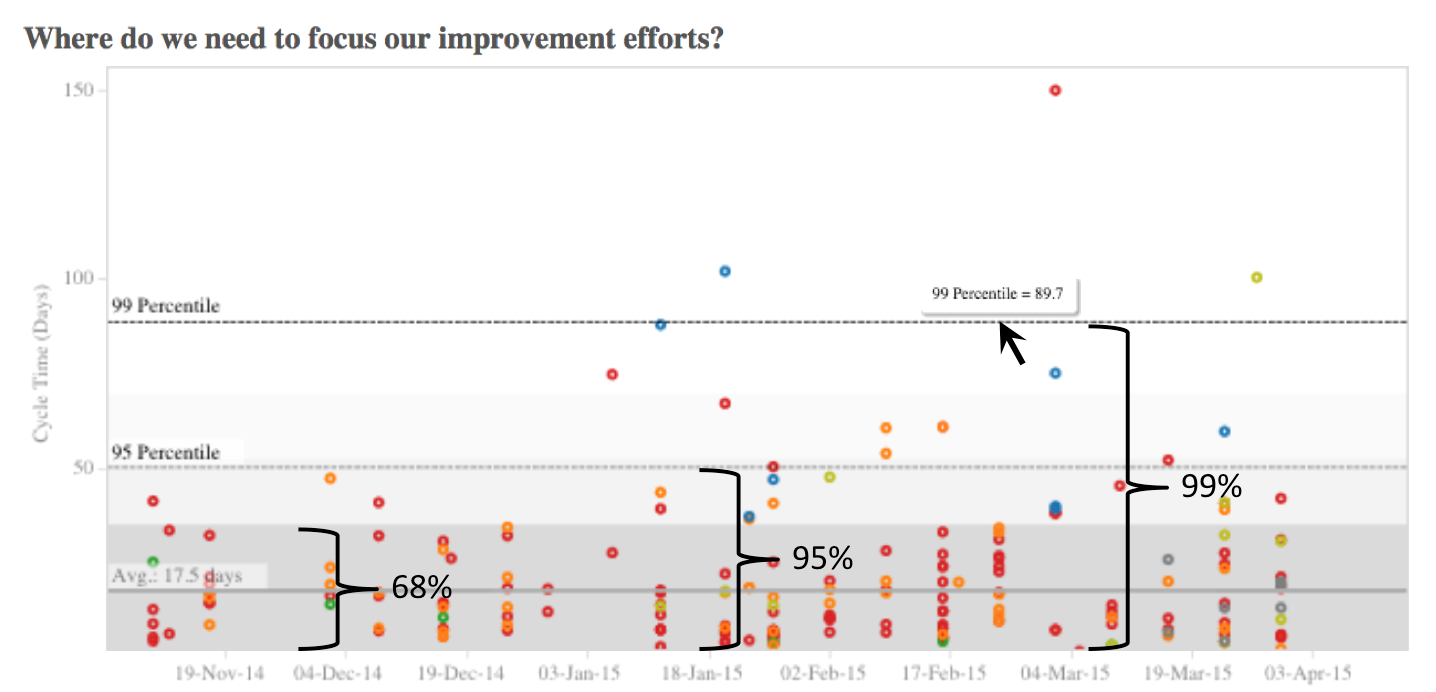
Teams can use a process control chart to graphically represent their cycle time and completion consistency. The Planview AgilePlace-generated chart above plots a team’s recent work items based on their cycle time. (Note: In this instance, cycle time refers to how many days it took to finish a work item.)
Zusätzlich zu der Anzeige der durchschnittlichen Zykluszeit des Teams (17.5 Tage), enthält das Diagramm drei Standardabweichungen, mit deren Hilfe Sie vorhersagen können, ob das Team eine Aufgabe innerhalb einer bestimmten Zeitspanne abschließen wird:
- 68% of the time, the team will finish a work item within 35.5 days.
- 95% of the time, the team will finish a work item within 54.5 days.
- 99% of the time, the team will finish a work item within 89.7 days.
The key to using a predictability chart is to take the range of possible delivery dates and apply them to your team’s work. Then, when you’re asked to provide an estimate of how long something will take, you can turn to the chart — instead of making an arbitrary guess. With about 70% certainty, you can say that your team can finish a work item in about 36 days. For a higher level of certainty, you know you need to start a work item about 55 days before it must be delivered. In contrast to estimates, using historical date ranges can give teams and their stakeholders a more realistic view of their anticipated cycle time.
Using Predictability Metrics for Continuous Improvement
In addition to more confident timelines, teams can use predictability charts for continuous improvement. For example, data points that fall inside the range of three standard deviations (99% confidence) are often referred to as being “in control.” In-control data points influence the bulk of our day-to-day improvement efforts. We can use them to improve predictability by reducing the range of outcomes.
Verwenden Sie erneut das oben gezeigte Diagramm: Wenn wir unser 95%-Konfidenzintervall von 55 auf 45 Tage reduzieren können, erreichen wir eine erhebliche Verbesserung der Vorhersagbarkeit. So können wir den Verpflichtungen, die wir gegenüber unseren Stakeholdern in Bezug auf die Lieferung wertvoller Arbeit eingehen, mit größerem Vertrauen nachkommen. Zu den Möglichkeiten, dies zu erreichen, gehören die Begrenzung der in Arbeit befindlichen Aufgaben, mehr Zeit für die Analyse und die Aufteilung von Aufgaben in kleinere Teile oder die Automatisierung wiederkehrender Prozesse.
It can also be useful to analyze the data points that lie outside the range of three standard deviations in a predictability chart. These points are considered “out of control,” but they’re excellent candidates for team retrospectives, lean coffees, or a root cause analysis. Investigating them can help you find ways to improve.
Das Fazit
Vorhersagemetriken können dazu beitragen, die Genauigkeit zu verbessern, indem sie Fakten in Ihre Analyse einfließen lassen. Mit Hilfe von Konsistenzdiagrammen können Sie realistischere Vorhersagen über die voraussichtlichen Ergebnisse der in Ihr System eingehenden Aufgaben machen. Mit dieser Kennzahl können Sie die Wirkung Ihrer Verbesserungsbemühungen messen und sich vertrauensvoll auf vernünftige Zeitpläne festlegen, die auf Fakten und nicht auf Schätzungen basieren.
Leseempfehlungen
- 7 Schlanke Metriken zur Verbesserung des Flusses
- Kanban: How to Get Started with Continuous Improvement (includes four Kanban metrics that any team can track)
- Enhanced Lean Metrics: More Speed and Insight
![Ein globaler Plan für kollaboratives Arbeitsmanagement [Video]](https://blog.planview.com/de/wp-content/uploads/2019/07/A-Global-Collaborative-Work-management-blueprint.png)