To find improvement opportunities, you look to the data. It offers the hard numbers that can help answer questions such as “Will we finish the work in time?” or “How can we adjust the process to improve flow?”
AgilePlace’s metrics and reports provide you with the data-driven insights you need to answer the tough questions. We’ve been overhauling our reporting engine to make our reports even faster and easier to use.
As the improvements gradually roll out, you’ll see the following enhancements:
- Verbesserte Leistung: Generieren Sie Ihre Planview AgilePlace Berichte schneller und interagieren Sie mit ihnen.
- Advanced sharing options: Communicate data points with your peers more easily
- Interactive reporting: Zoom in or out, and instantly include or exclude data ranges
Run Lean Reports More Quickly
Mit unserem neuen und verbesserten Reporting-Backend können Sie Ihre Planview AgilePlace-Berichte noch schneller ausführen. Dies macht es viel einfacher, Ihre Berichtseingaben zu ändern, einschließlich: Fahrspuren, Kartentypen, Daten, Tags und benutzerdefinierte Klassensymbole, und Ihren Bericht schnell erneut auszuführen. Das bedeutet, dass Sie nicht mehr minutenlang warten müssen, bis Ihre Berichte ausgeführt werden - Sie sehen sie in Sekundenschnelle.
Share Insights with Your Colleagues
Communicate the right information to the right people using the new sharing options. Forward along the details of your reports by exporting images, PDFs, summary data sets, or underlying data sets. You’re now armed with functionality that fosters even more collaboration about the metrics that matter most.
Dig Into Your Data
A cleaner and more interactive user interface means the reports are easier to update, calibrate, and consume. The new reports allow you to highlight specific areas of data for focused views. Zoom in on specific data points and quickly compare calculations by including and/or excluding data. Update reports on-the-fly by selecting or deselecting lanes and additional criteria.
Vier erweiterte Berichte, die es in sich haben
Every action is recorded in Planview AgilePlace to generate metrics on cycle time, variability, efficiency, and workload distribution. These key metrics feed into four different reports to help provide you with insight into flow, predictability, and risk.
Geschwindigkeit
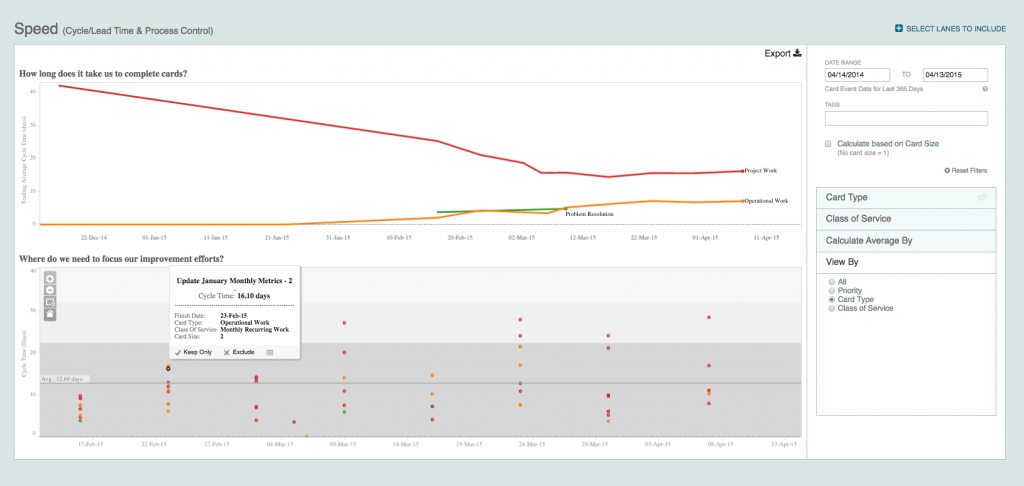
How long does it take us to complete cards?
In the cycle time report, you can see the average time that it takes to finish all of your work. Easily tailor your cycle time “clock” by selecting lanes to indicate where a card starts and finishes. Selecting multiple finish lanes allows you to see how long it takes work to get from the starting point to one of many places it may go from there. Zoom in to look at additional details and compare/contrast cycle times of different groups of work items by priority (e.g., to help monitor SLAs) and type of work (e.g., evaluate task card type versus defect card type).
Where do we need to focus our improvement efforts?
The process control chart looks at how consistently and predictably work is moving through your process. Each dot is a finished work item. You can see the average time that work takes, how widely dispersed it is, and how much variability there is in the process based upon three standard deviations. Additionally, lines embedded on the report indicate work that falls within both the 95% and 99% ranges to help you measure predictability with confidence.
Flow/Forecast
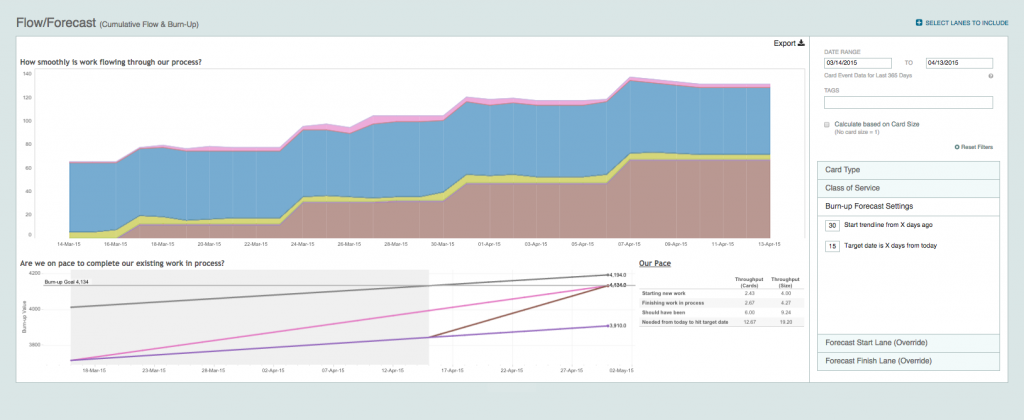
Wie reibungslos fließt die Arbeit durch unseren Prozess?
Flow helps you visualize the amount of work in various states and stages of your process over time and the associated trends. With this information, quickly identify bottlenecks to improve your flow of value delivery. Customize your report by selecting which lanes to include in the analysis. In this report, view your WIP (X-axis) and mean cycle time (Y-axis) for any point in time over the past 365 days.
Sind wir auf dem richtigen Weg, unsere laufenden Arbeiten abzuschließen?
Um den Aufwand zu prognostizieren, zu verstehen, wo Effizienzgewinne möglich sind, und den Durchsatz zu ermitteln (z. B. Karten/Tag, Story Points/Iteration), stehen Ihnen Ihre Burnup-Trajektorie und Details zum Tempo zur Verfügung. Anhand dieser Daten können Sie Fragen beantworten wie "Wie viel schneller müssen wir sein, um fertig zu werden?" und "Fügen wir dem System zu viel Arbeit zu?" Passen Sie die Parameter Ihrer Projektion ganz einfach an, um anzugeben, wie weit in die Zukunft Ihr Ziel reicht und wie weit zurück Sie Trenddaten verwenden möchten. Mit Burnup Trajectory geht Planview AgilePlace einen Schritt weiter als das Konzept des Burndown-Diagramms, um einen genauen Einblick in den Gesamtfortschritt Ihres Releases oder Sprints zu geben.
Distribution
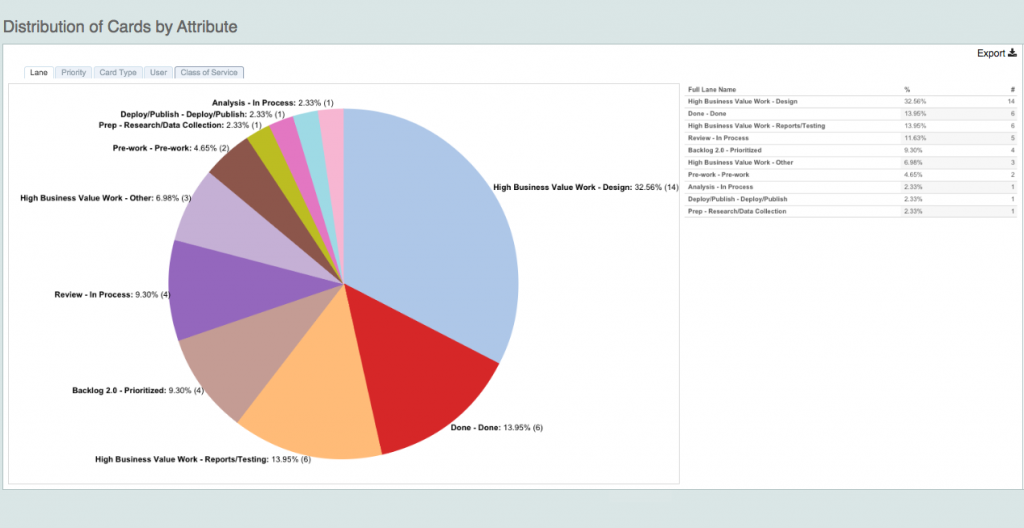
Wie ist die Arbeit auf Spur, Priorität, Kartentyp, Benutzer und benutzerdefinierte Klasse verteilt?
Distribution shows the breakout of all of your work by both count and percentage of the whole. Quickly see work that’s unassigned and where you’re taking on too much work.
Effizienz
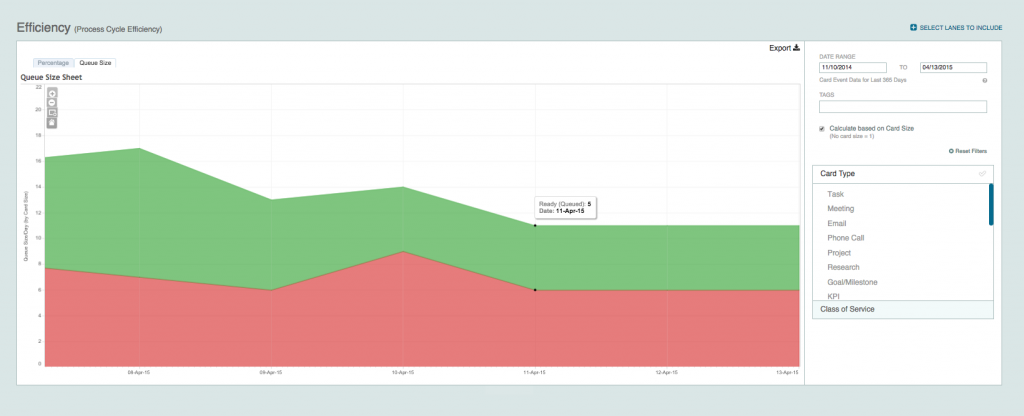
How are queues impacting our flow?
Die Verwaltung von Warteschlangen ist wichtig, denn das Warten trägt zu Ihrer Vorlaufzeit bei und wirkt sich auf diese aus. Das Effizienzdiagramm zeigt die gesamte in der Warteschlange befindliche Arbeit an und liefert ein Maß für den gesamten WIP (z.B. eine Übersicht darüber, wie viele Arbeitsposten sich derzeit auf der Tafel befinden). Anhand der Expansions-/Vertragszyklen in diesem Diagramm können Sie erkennen, wo die Warteschlangen zu groß werden und möglicherweise WIP-Limits erforderlich sind, um die Effizienz der Abläufe zu verbessern.
Tipp: Markieren Sie die Lanes als "fertig", "in Arbeit" und "abgeschlossen" in den Einstellungsoptionen Ihres Board-Editors, um die Informationen, die Sie in diesem Diagramm sehen, zu verfeinern.
Check out the New Reports
Die erweiterten Berichtsfunktionen von AgilePlace werden schrittweise eingeführt und ersetzen automatisch die aktuellen Berichte in der Anwendung. "Anleitungsartikel zu diesen Berichten werden in unserer Wissensdatenbank zur Verfügung gestellt.
Please contact us if you have questions about any of the new reports or if you’re interested in upgrading your account to start using reports that aren’t currently available to you.
Bitte beachten Sie: Die neuen Berichte von Planview AgilePlace werden vom Internet Explorer 8 (IE8 und darunter) nicht unterstützt. Wir werden mit Kunden, die diesen Browser noch verwenden, zusammenarbeiten, um die Auswirkungen zu minimieren.
![Ein globaler Plan für kollaboratives Arbeitsmanagement [Video]](https://blog.planview.com/de/wp-content/uploads/2019/07/A-Global-Collaborative-Work-management-blueprint.png)