To find improvement opportunities, you look to the data. It offers the hard numbers that can help answer questions such as “Will we finish the work in time?” or “How can we adjust the process to improve flow?”
AgilePlace’s metrics and reports provide you with the data-driven insights you need to answer the tough questions. We’ve been overhauling our reporting engine to make our reports even faster and easier to use.
As the improvements gradually roll out, you’ll see the following enhancements:
- Förbättrad prestanda: Generera och interagera med dina Planview AgilePlace-rapporter snabbare
- Advanced sharing options: Communicate data points with your peers more easily
- Interactive reporting: Zoom in or out, and instantly include or exclude data ranges
Run Lean Reports More Quickly
Med vår nya och förbättrade rapportbackend kan du köra dina Planview AgilePlace-rapporter ännu snabbare. Detta gör det mycket enklare att ändra dina rapportinmatningar, inklusive banor, korttyper, datum, taggar och anpassade klassikoner och snabbt köra om rapporten. Det innebär att du inte längre behöver vänta i flera minuter på att dina rapporter ska köras - du ser dem på några sekunder.
Share Insights with Your Colleagues
Communicate the right information to the right people using the new sharing options. Forward along the details of your reports by exporting images, PDFs, summary data sets, or underlying data sets. You’re now armed with functionality that fosters even more collaboration about the metrics that matter most.
Dig Into Your Data
A cleaner and more interactive user interface means the reports are easier to update, calibrate, and consume. The new reports allow you to highlight specific areas of data for focused views. Zoom in on specific data points and quickly compare calculations by including and/or excluding data. Update reports on-the-fly by selecting or deselecting lanes and additional criteria.
Fyra förbättrade rapporter som ger en kraftfull effekt
Every action is recorded in Planview AgilePlace to generate metrics on cycle time, variability, efficiency, and workload distribution. These key metrics feed into four different reports to help provide you with insight into flow, predictability, and risk.
Hastighet
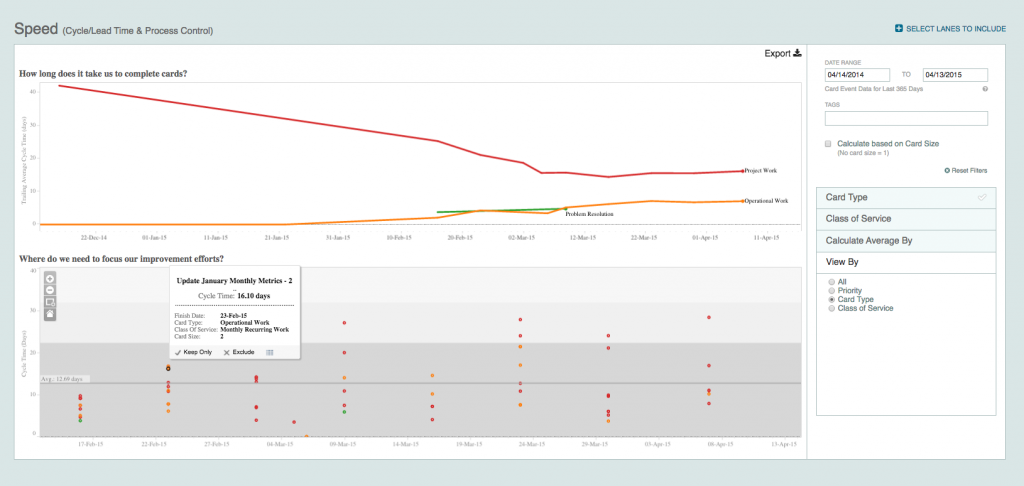
How long does it take us to complete cards?
In the cycle time report, you can see the average time that it takes to finish all of your work. Easily tailor your cycle time “clock” by selecting lanes to indicate where a card starts and finishes. Selecting multiple finish lanes allows you to see how long it takes work to get from the starting point to one of many places it may go from there. Zoom in to look at additional details and compare/contrast cycle times of different groups of work items by priority (e.g., to help monitor SLAs) and type of work (e.g., evaluate task card type versus defect card type).
Where do we need to focus our improvement efforts?
The process control chart looks at how consistently and predictably work is moving through your process. Each dot is a finished work item. You can see the average time that work takes, how widely dispersed it is, and how much variability there is in the process based upon three standard deviations. Additionally, lines embedded on the report indicate work that falls within both the 95% and 99% ranges to help you measure predictability with confidence.
Flow/Forecast
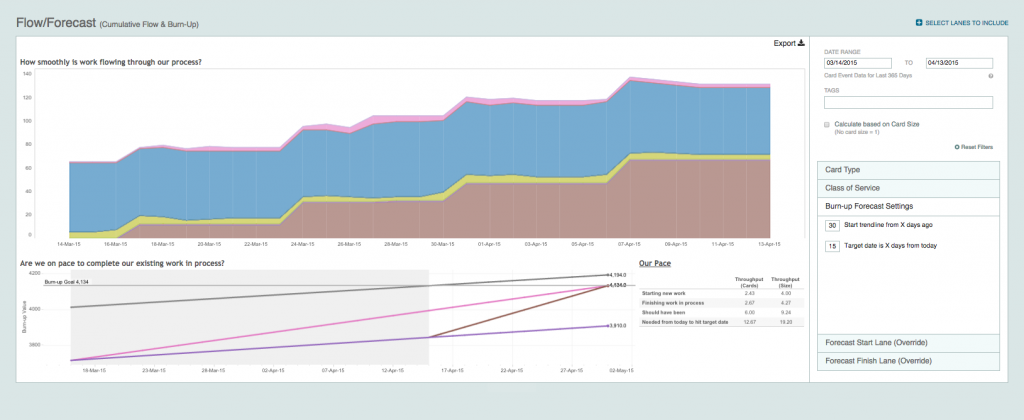
Hur smidigt flyter arbetet genom vår process?
Flow helps you visualize the amount of work in various states and stages of your process over time and the associated trends. With this information, quickly identify bottlenecks to improve your flow of value delivery. Customize your report by selecting which lanes to include in the analysis. In this report, view your WIP (X-axis) and mean cycle time (Y-axis) for any point in time over the past 365 days.
Är vi i takt med att slutföra våra pågående arbeten?
För att förutse ansträngningen, förstå var effektivitetsvinster kan uppnås och identifiera genomströmningen (t.ex. kort/dag, story points/iteration) finns din burnupbana och uppgifter om tempo tillgängliga. Med hjälp av dessa data kan du svara på frågor som "Hur mycket snabbare måste vi gå för att bli klara?" och "Lägger vi till för mycket arbete i systemet?". Du kan enkelt justera parametrarna för din projektion för att ange hur långt in i framtiden ditt mål ligger och hur långt tillbaka du vill använda trenddata. Med Burnup Trajectory tar Planview AgilePlace konceptet med burndown-tabellen ett steg längre för att ge exakt information om den övergripande utvecklingen av din release eller sprint.
Distribution
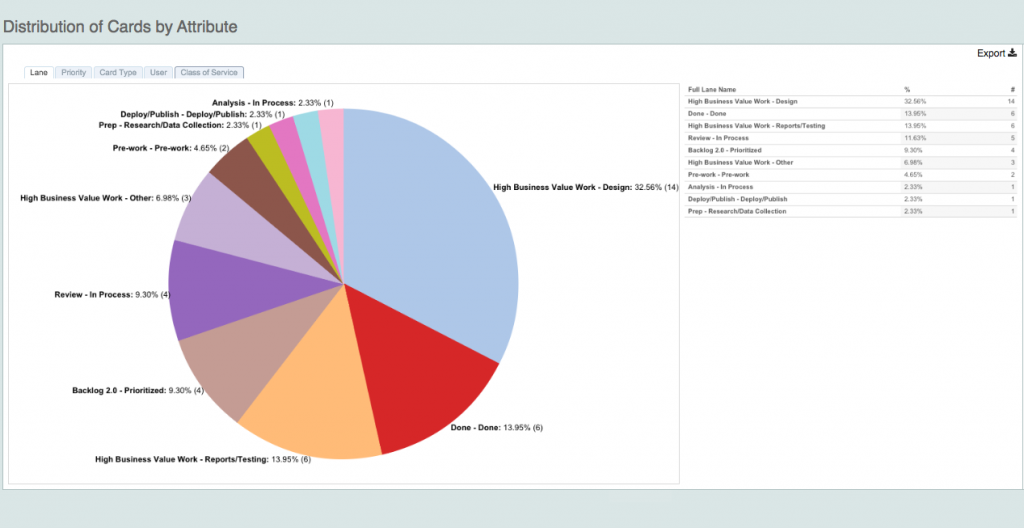
Hur fördelas arbetet mellan körfält, prioritet, korttyp, användare och anpassad klass?
Distribution shows the breakout of all of your work by both count and percentage of the whole. Quickly see work that’s unassigned and where you’re taking on too much work.
Effektivitet
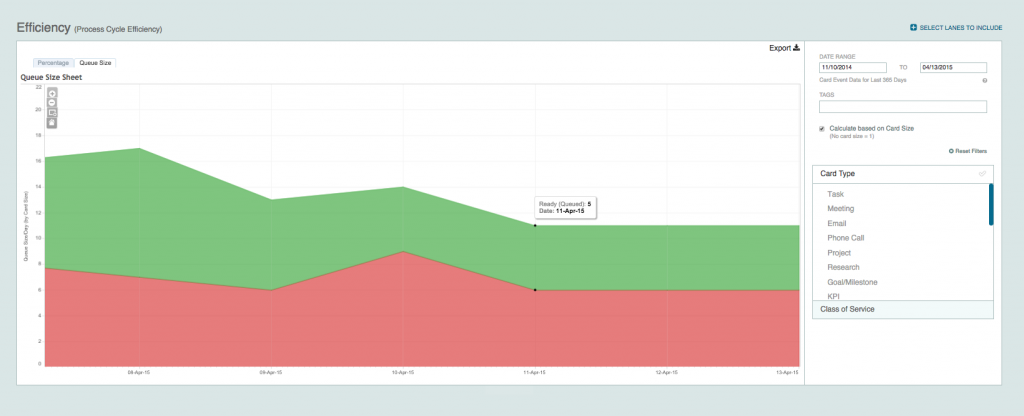
How are queues impacting our flow?
Det är viktigt att hantera köer eftersom väntan bidrar till och påverkar ledtiden. Effektivitetsdiagrammet visar det totala arbetet i kö och ger ett mått på den totala WIP (t.ex. en sammanställning av hur många arbetsuppgifter som för närvarande finns på tavlan). Genom att granska expanderings- och kontraktscyklerna i det här diagrammet kan du förstå var köerna blir för stora och kanske behöver WIP-gränser för att förbättra flödeseffektiviteten.
Tips: Märk banor som "redo", "pågående" och "färdig" i inställningsalternativen för brädredigeraren för att förfina den information som visas i diagrammet.
Check out the New Reports
AgilePlaces förbättrade rapporteringsfunktionalitet kommer att införas gradvis och kommer automatiskt att ersätta de nuvarande rapporterna i applikationen. "Artiklar om hur man gör med dessa rapporter kommer att finnas tillgängliga i vår kunskapsdatabas.
Please contact us if you have questions about any of the new reports or if you’re interested in upgrading your account to start using reports that aren’t currently available to you.
Observera: Planview AgilePlaces nya rapporter stöds inte av Internet Explorer 8 (IE8 och senare). Vi kommer att samarbeta med kunder som fortfarande använder den här webbläsaren för att minimera konsekvenserna.
![En global plan för hantering av samarbetsarbete [Video]](https://blog.planview.com/se/wp-content/uploads/2019/07/A-Global-Collaborative-Work-management-blueprint.png)