
A predictable outcome is one of the most sought-after goals in any business or initiative. It’s easy to see why.
We often correlate predictability with attractive benefits like lower risk, higher business value, and maybe even less stress. So with every new project, we dutifully gather time, effort, and resource estimates from all involved — hoping that this time we’ll nail it.
Except we rarely do.
Fact-Based Predictability with Lean Metrics
Predictability metrics help teams make more accurate estimates about the completion and consistency of their work items. This can lead to better work prioritization and more targeted communications among stakeholders.
"Om man kan fatta beslut som bygger på fakta snarare än på prognoser får man resultat som är mer förutsägbara. Lean Development är konsten och disciplinen att basera åtaganden på fakta snarare än prognoser."
— Mary Poppendieck, Lean Development and the Predictability Paradox (2003)
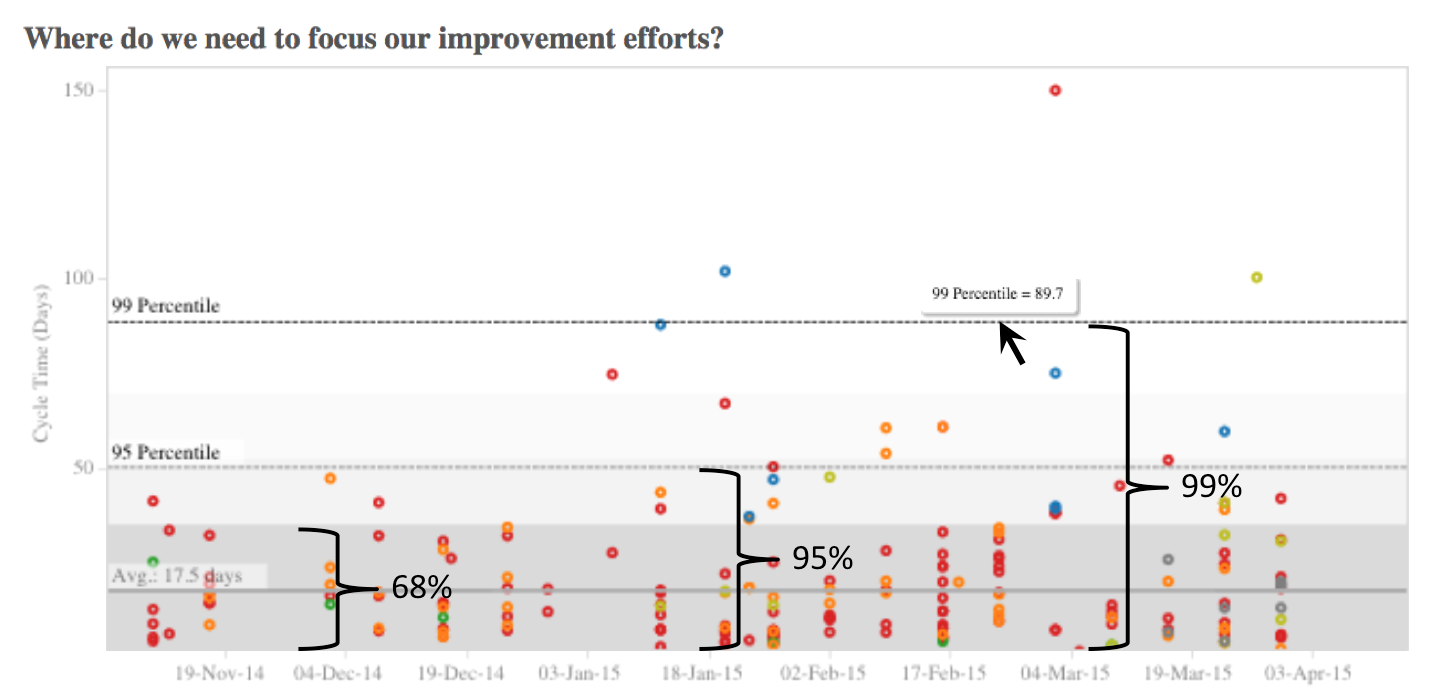
Teams can use a process control chart to graphically represent their cycle time and completion consistency. The Planview AgilePlace-generated chart above plots a team’s recent work items based on their cycle time. (Note: In this instance, cycle time refers to how many days it took to finish a work item.)
Förutom att visa lagets genomsnittliga cykeltid (17.5 dagar), innehåller diagrammet tre standardavvikelser för att hjälpa till att förutse om teamet kommer att slutföra ett arbetsmoment inom en viss tidsperiod:
- 68% of the time, the team will finish a work item within 35.5 days.
- 95% of the time, the team will finish a work item within 54.5 days.
- 99% of the time, the team will finish a work item within 89.7 days.
The key to using a predictability chart is to take the range of possible delivery dates and apply them to your team’s work. Then, when you’re asked to provide an estimate of how long something will take, you can turn to the chart — instead of making an arbitrary guess. With about 70% certainty, you can say that your team can finish a work item in about 36 days. For a higher level of certainty, you know you need to start a work item about 55 days before it must be delivered. In contrast to estimates, using historical date ranges can give teams and their stakeholders a more realistic view of their anticipated cycle time.
Using Predictability Metrics for Continuous Improvement
In addition to more confident timelines, teams can use predictability charts for continuous improvement. For example, data points that fall inside the range of three standard deviations (99% confidence) are often referred to as being “in control.” In-control data points influence the bulk of our day-to-day improvement efforts. We can use them to improve predictability by reducing the range of outcomes.
Använd återigen diagrammet ovan: Om vi kan få ner vårt 95% konfidensintervall från 55 till 45 dagar, kommer vi att få en stor förbättring av förutsägbarheten. Vi kan då vara mer säkra på de åtaganden vi gör gentemot intressenterna när det gäller att leverera värdefullt arbete. Detta kan vi göra genom att begränsa vårt pågående arbete, lägga mer tid på att analysera och dela upp arbetsuppgifter i mindre delar eller arbeta för att automatisera återkommande processer.
It can also be useful to analyze the data points that lie outside the range of three standard deviations in a predictability chart. These points are considered “out of control,” but they’re excellent candidates for team retrospectives, lean coffees, or a root cause analysis. Investigating them can help you find ways to improve.
Slutsats
Förutsägbarhetsmått kan bidra till att förbättra noggrannheten genom att ge fakta i analysen. Genom att använda diagram över konsekvenserna av färdigställandet kan du göra mer realistiska förutsägelser om de framtida resultaten av de arbetsuppgifter som kommer in i ditt system. Detta mått kan hjälpa dig att mäta effekten av dina förbättringsinsatser och göra det möjligt för dig att tryggt förbinda dig till rimliga tidsramar baserade på fakta, inte uppskattningar.
Rekommenderad läsning
- 7 Lean Metrics för att förbättra flödet
- Kanban: How to Get Started with Continuous Improvement (includes four Kanban metrics that any team can track)
- Enhanced Lean Metrics: More Speed and Insight
![En global plan för hantering av samarbetsarbete [Video]](https://blog.planview.com/se/wp-content/uploads/2019/07/A-Global-Collaborative-Work-management-blueprint.png)