
When we ask customers why they want a PPM solution, the top reason is usually to gain visibility into their data so they can improve decision making. They are wondering: How can I make PPM data analytics easier? Analytics and Reporting is the gateway to data visibility and has been the largest area of R&D investment for Planview Enterprise.
Methods for visualizing data have advanced greatly since the days of Crystal reports, which took submitting a request to a specialist and waiting for days to get the report. Today, there are all kinds of new analytics and reporting technologies.
But rather than focus on what the latest technology can do, we felt it was vital to first understand how our customers actually want to use their PPM data.
About two years ago, we met with more than 40 customers to learn more about how Planview Enterprise Analytics and Reporting were meeting their needs.
The general consensus from customers was while they loved the wealth of data available to them, they had many ideas on how we could make it easier to use the data more effectively.
These ideas boiled down to three core themes:
- Simplification – make the data easier to access and manage
- Unification – provide the analytics where the customer is working, so users don’t have to leave the context of Planview Enterprise
- Self-service – give users the reports they need, when they need it, so they don’t have to request the report and wait for someone else to make it available
These themes have been guiding principles as we’ve expanded both the integrated analytics functionality two years ago in Planview Enterprise 11 and the Microsoft Power BI support in Planview Enterprise 11.5 last year.
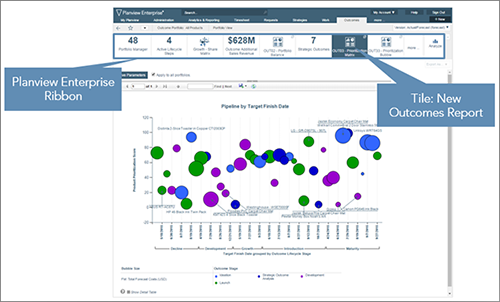
Planview Enterprise 12, the latest release of our resource and portfolio management solution, offers new reporting enhancements available via the Planview Enterprise ribbon interface:
- Outcome reports that show how investments translate into products, applications, services or other relevant organizational outcomes
- New best practice Business Case/Gate Submission reports that pull together information from work intake to generate project, program or outcome proposals
- Program reports designed to help portfolio managers and executives understand program status and performance
We’ve also taken the next step on our journey with Microsoft Power BI. I’m excited that these powerful data visualizations are now embedded and accessible within the Planview Enterprise ribbon. You can now view Planview Enterprise data as a Power BI visualization by way of a single click of a Planview Enterprise tile.