
When it comes to reporting, organizations often struggle to develop reports that are both easily digestible and highly informative. There’s a fine line in this balance, as teams want to be able to report the data that matters most. But siphoning through all that data in spreadsheets can be time consuming and ultimately can lead to mediocre results. Advancing the capabilities of complex reporting to improve decision making is something Emilie Graveline from Agropur understands all too well, which is why she is the first to be showcased in our series that puts a spotlight on women leaders in tech.
In this blog series, we’ll feature the women in technology across a variety of industries that are making a difference within their organization and have candid conversations about their achievements and successes that make a major difference in their businesses every day.
To kick off the series, we spoke with Emilie Graveline from Agropur, as she is leading the way in improving reporting and better decision making within her organization. Let’s jump right in to the interview on just how she is driving this change.

What is your role in the EPMO?
As a Support and Improvements Analyst at Agropur, my team and I are responsible for the overall administration of Planview® Portfolios—our enterprise-wide portfolio and resource management solution—and we ensure that it supports our strategic processes and procedures effectively. We are responsible for establishing and communicating project management best practices, providing end-user training, and building and sharing reports and dashboards for every level of management, helping them with their decisions related to projects.
Who are your stakeholders and how do you engage them to understand desired outputs?
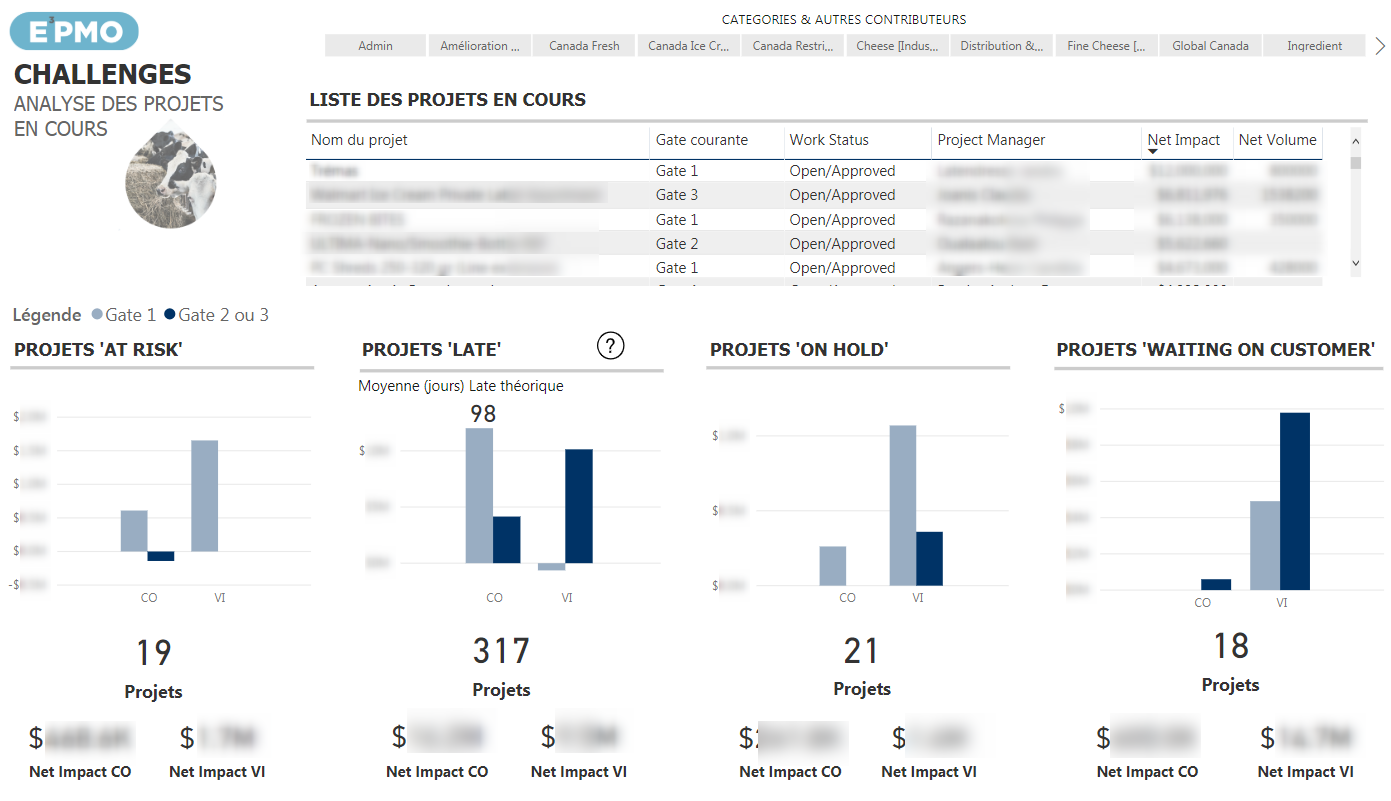
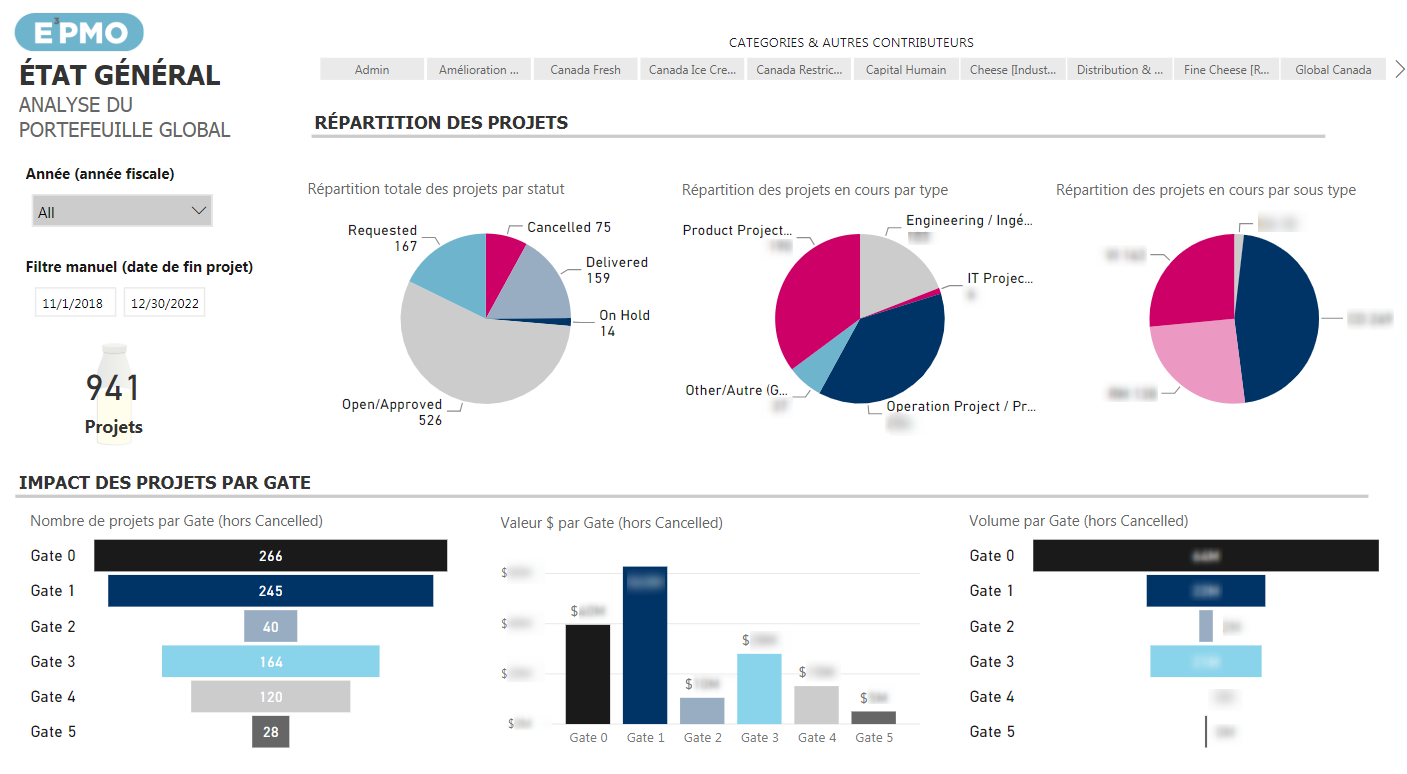
Our stakeholders have diverse levels of project management maturity and are interested in various kinds of data to make their decisions. Some are using the data to manage their teams and workload at a very granular level and require visuals showing project tasks and resource efforts to support their weekly meetings. Some are using time sheets to look at past effort, but by simply reserving resources on projects, it is possible to get important insight on our capacity to deliver projects. On the other end, we have executive management asking for dashboards that show a summary of projects. We provide one-page reports showing projects at risk, prioritization of new projects, and health status on big projects.
How is the organization using the data you provide?
We create and publish reports to make them available to different audiences. For example, the EPMO is leading governance committees where project prioritization and capacity management are reviewed. We build reports to support real-time analysis during the meetings. Our time to market KPI analysis is an example of information we take from Planview (Gate dates) and that we transform to highlight trends and make comparisons.
We also do cross-database analysis (because most of our financial information is stored in Oracle) to assess how projects are doing from a financial perspective. PowerBI reports allow us to have a complete picture by bringing it all together.
Explain the value of keeping visualizations simple. How is showing less data in a given output valuable?
We know it when we share a report with too much data because we will get a ton of questions on each visual’s meaning and where the data is coming from.
The key is to focus on which action needs to be taken related to a specific KPI. Instead of showing a complete but confusing picture of a portfolio, we prefer to highlight only specific aspects of projects and make sure that the main information is understood.
We found it best to segregate information by theme on different report pages, so everyone understands the purpose of the report and what needs to be done according to the info that is on it.
How does applying color to the physical formatting of the data improve the way in which the reports are consumed?
We discovered that matching the organization’s new brand identity and colors gave credibility to our reports. People naturally think that the data is more up-to-date and reliable when it is presented in a template that they are used to seeing and working with.
Do you need to be an expert to analyze data in PowerBI?
You don’t need to be an expert to start using PowerBI. Our team had no experience with any IT development or BI software. The Power BI platform is user-friendly, and if you have trouble with the more “technical parts,” there are options to get you started:
- Sqlbi.com offers an Introduction to DAX formulas course. This is perfect for you if you need to create measures and derive information from raw Planview data.
- Power Bi forum is useful when you encounter an error message or if you would like tips and tricks on how to play with visuals.
- Planview Customer Success Center is a must to get all the how-to on data connections and ways to share your reports.
Where would you recommend starting with Power BI and Data Visualization?
You don’t need to wait until you have a perfectly clean database to start. Start by asking yourself what situation you want to highlight or what management would want to act on. Then build a report demonstrating just that and share it with a group in your organization. Chances are they will react like our colleagues, and you’ll get two outputs.
1) Project managers will see data that is inaccurate and will make the appropriate changes in Planview Portfolios to reflect what is really going on with their projects.
2) Project managers will see the kind of information that is available to them and will get back to you with more details, requirements, and needs. Then, you can simply iterate on that and share it to a new group.
If you could go back to the beginning of your implementation of PowerBI, what would you do differently based on what you have learned and what you know now?
When we started, we wanted to show everyone at Agropur how great PowerBI is, and we created custom reports for a lot of people and then realized how much work it was to maintain them. Now, we are more focused on building reports that support the big picture, reports that are a lot more standard and that will be used by a majority. We try to keep to a minimum the reports that we must manually update. We are always creating new views and visuals, but our goal is to build them in a way that they can be automatically updated through a job stream or only once a month.
What was it like spearheading this initiative and where do you see it going forward?
At first, we were using PowerBI to crunch our raw data but were then sharing it with screenshots in PowerPoint presentations. Now, we give stakeholders the power of the interactivity that PowerBI offers. We have more people wanting to use it to create their own reports and dashboards. It is remarkable but also a challenge to make sure the info is always accurate, and that sensitive data is secure no matter who is behind the report. To that end, we are in the process of getting a standard governance process based on PowerBI usage best practices. If you plan on opening the gates to the database to a broader developer audience, I recommend you do the same.
Who has been your biggest supporter in this process?
Cassandra Imbeault, previously Support and Improvements Analyst at the EPMO, as she also presented our Power BI utilization case in Toronto and at Horizons (the Planview Customer Conference). She is my go-to-person every time I get an error message I have never seen before or when I need to merge multiple queries to get my data in shape for a specific visual. Her curiosity and cartesian mind don’t know what impossible means and that shows in her work. To get her understanding and capabilities to the next level, she attended courses on DAX formulas, database models, and Power BI over the last two years. She then made sure to pass on some of this knowledge to me. Moreover, she taught me important reflexes and tips to get a clean database before starting to create a report. I love to create visually appealing reports, but the data that is behind it is what needs to get the most attention.
How has this process impacted your leadership skills?
Being at the beginning of my professional career, I never really had to think about what managers would want to see to make strategic calls. Being involved in the building process of these reports allowed me to listen and participate in discussions around this topic. The EPMO director, Joel Bertaud, is always encouraging me to make comments on what kind of information I think we need to provide to the higher management. He is then giving me autonomy on finding a way we will deliver the required information.
We live in an era where knowledge is at our fingertips and we need to take advantage of it. Getting to know Power BI from scratch in this job has taught me that we never stop learning and that we need to stay up-to-date because technologies are evolving fast. Being part of a community sharing the same interests is perfect for that, so I never forget to help others going through the same learning process. But I must say that I am often the one asking questions to my colleagues!

Thank you for sharing your experience with us, Emilie, and congratulations on helping to shape the way people are making decisions at Agropur. It is amazing and inspiring what you and your team have accomplished spearheading the data reporting challenge within your organization.
Stay tuned for our next Women in Tech series recognizing some of the incredible women in our customer base who are managing, coaching, and leading the charge in their respective industries. To learn more about how Planview can help you with your portfolio and resource management practices, check out our website or watch a demo.