If you work in an environment similar to mine, you’re probably challenged on a daily basis to improve data integrity for users, provide them easy access to information, and make quick changes to reduce their frustrations. I have eight simple hacks that I’ve used with Planview Portfolios® to address all these challenges, building engagement and having a little fun in the process. And, don’t laugh, one of these hacks involves cat memes.
As a business systems analyst with Manulife, probably better known as John Hancock, I am part of a team of 35,000 employees and 73,000 agents who help customers around the world achieve their financial goals through insurance, financial advice, and wealth asset management solutions.
I’m part of the Canadian division PMO where we provide project management frameworks, processes and tools to help the company manage projects that deliver value to our customers. And we’ve been doing this with Planview since 2014, which is currently helping us with about 600 active projects with 1,900 or more resources, and a small and mighty team of three administrators. This is how I’ve been able to develop the following eight life hacks to simplify using Planview Portfolios.
Hack #1: Easy Custom Help Tiles with BI/SSRS
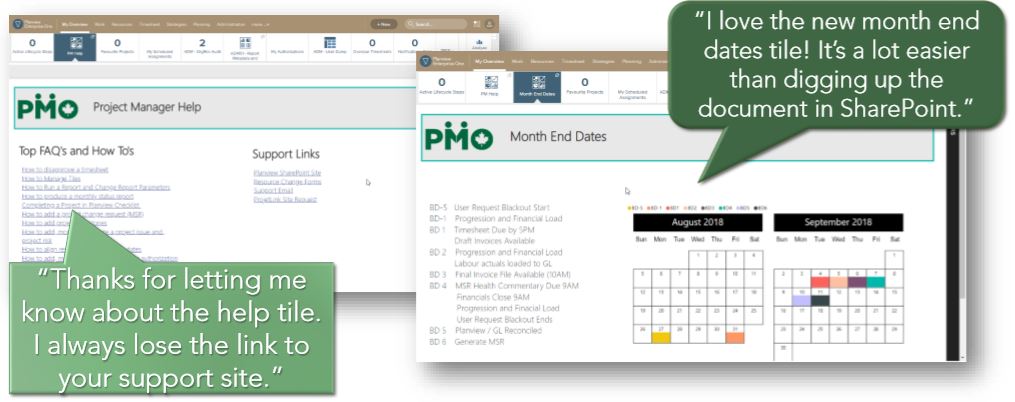
This step is especially helpful for project managers who are constantly dealing with requests for the same help links and support in Planview.
These colleagues work with Planview administration as well as supporting tons of other tools. So how can you reduce their frustrations? One way is to create custom ribbon help tiles that point to things like documentation, FAQs, and intake forms. These help tiles are created easily with Microsoft Power BI without any code. If you can create a presentation, you should be able to quickly make up an engaging tile in Power BI.
The Power BI is only available in the “My Overview” section of Planview, but you can also use SSRS reports that are more tailored to PM/RM in a work/resource tab. Without a lot of work, you can create tiles that look like the ones below.
Hack #2: Capture Actual Forecast Financial Trends
We came across this hack when our portfolio management team asked for a database of monthly trending data for actual forecasts. We really didn’t want to create a database that showed all the benefits and trends.
So, we took another route that shows how a forecast is trending and identifies projects with big budget swings over weeks or months. And after six months, what we discovered was jaw dropping.
The hack here is to add financial versions for the number of periods you want to track in the report over 12 months or by the quarter. Then set up a job stream to capture that trend and use variance in the portfolio view to see changes, like below.
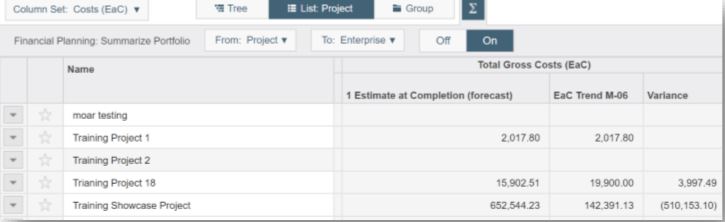
As a result of this approach, we’ve been able to identify numerous projects of more than $1 million with cost swings in excess of 10 percent month over month. This gives us a good indicator and an excuse to reach out to the Project Manager (PM) to see what’s going on and make sure changes or significant risks are being captured. It helps justify “givebacks” to fund new projects. And you can monitor overall portfolio trends against budget.
Hack #3: History Track Team & Resource Hierarchy Information
This hack really depends on how you manage your resources. At Manulife, we have resources that move to different teams as well as a deactivated area. So, we have to report on team resources at a certain point of time and provide RMs with easy access to terminated resources. If you’re in the same situation and use this hack every time you create or edit a resource, you’ll be amazed at the results.
Primary structures don’t track history, which means you have to create additional structures to track parts of the hierarchy that are important to you. The great thing about this is that FastTrack Analytics will use historical values, usually limited to the first three attributes. If you’re using a deactivated area, you can create and share portfolios for a resource manager’s terminated resources. But make sure when doing this that you audit the new structures.
With this approach, you can validate timesheet compliance reporting and support reporting for teams that churn through a lot of vendors. And as an added bonus, you can show parts of the resource hierarchy in portfolio views.
Hack #4: Track Resource Managers in Planview
This hack is great for anyone who is tired of constantly being asked to identify a resource manager in a project. With this hack you can create automatic organizational charts to show all the teams within Planview Portfolios, primary contacts, and the resource managers.
You can see a person’s resource manager in two ways—either add that information directly to the resource or have it in a dropdown field directly on each resource—adding it as a per resource attribute or associate it to OrgRes.
This hack helps reduce support traffic and use the information in custom reports for timesheet compliance, scheduled vs. actual resources and an organizational structure report to share with people who don’t have Planview Enterprise.
Hack# 5: Adding Fun to Planview Administration
For anyone who might be bored with struggling with timesheet compliance and data integrity or just want to show their festive spirit, here are a few ways to leverage fun and games inside Planview. These weird tricks have been shown to increase user engagement by more than 20 percent using a carrot instead of a stick.
- Decorate for the holidays by using the configurable text and color options to add some holiday fun.
- Game-ify compliance by incorporating contests, competition and games to keep users engaged.
- Create timesheet compliance reports that encourage team spirit and competitiveness.
- Send out reminders on rewards instead of potential penalties for compliance.
- Incorporate incentives into your integrity checks with contents or cat memes. Remember I said there would be cat memes?

Hack #6: Creating Virtual Columns
This hack has really saved our bacon a couple of times. If you ever wanted to use multi-select structures, complex calculations, data from associated structures, or advanced lifecycle information in a column set or report, what you can find in the database is a complete game changer.
If you can get this information through SQL, you can display it as a virtual column. It’s not something that is well-advertised because it might easily be abused and create poor performance issues. If you use this hack, consider approaching global services for support.
Hack #7: Overriding Default User Preferences
We came across this hack in response to a couple of consistent problems. We strictly use reserves. We don’t use allocations at all. But because of the way defaults were set, we found tons of people creating allocations, which are difficult to roll back.
So, if you have to train people to change user preferences or deal with users creating allocations instead of reserves, and you find no humor in $1 billion projects being set up, use this hack and be amazed at what happens next.
While there is no way to change global defaults via the GUI, they can be set directly in the database. These defaults will apply only to users who haven’t logged in. They can be wiped during upgrades and will need to be reapplied. So, it’s advisable to employ global services on this one too.
By employing this hack, we virtually eliminated issues with people creating allocations and we reduced training sessions by five minutes by removing the section on setting up preferences. There’s less confusion over keep duration and recalculate duration. We have no mystery billion-dollar projects. And we’ve reduced support for show finished reserves. Now we just delete them.
I hope you’ll find these hacks as useful as we do. If so, please share them with other Planview customers. All our discoveries like these advance Planview Portfolios and make it even better.