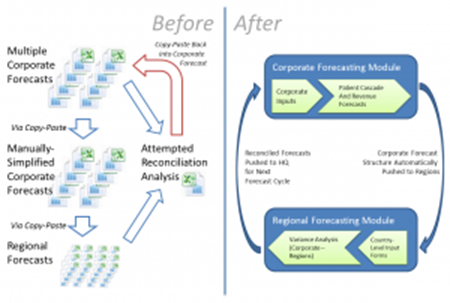
A common problem in both portfolio management and sales and operational planning (S&OP) is reconciling product revenue forecasts between a company’s regional sales analysts and its corporate decision-makers. Typically, regional sales analysts focus on short-term objectives, and their forecasts must align with targets or commitments set by regional heads. By contrast, corporate staff tend to be strategically oriented, using long-term forecasts that extend beyond region- or country-specific details. Forecasting is an iterative process, and without a common platform, it’s easy to lose track of the latest inputs as corporate and regional teams try to reconcile differences and harmonize assumptions. This often leads to a chaotic scramble in order to get reports and figures ready for the portfolio review.
Yours, Mine, and Ours
Recently, we customized an instance for a customer’s corporate analyst team. Their model included a range of products and indications in their top 15 markets. While this full-featured system contained a range of sophisticated market and competitive analytics necessary for modeling a long-term product forecast, the customer quickly realized that without a complementary system for analysts in each country, they could not easily compare and reconcile their top-down and bottom-up forecasts. Sharing their system with the regional analysts was not a practical solution since the analytics in the corporate system would be overkill for the regional teams, requiring extensive training and oversight. The practical solution was to add a separate model for the key regions’ short-term product forecasts that was linked to the corporate model. This would meld the advanced analytics of the corporate model with a traditional S&OP approach for regional data gathering and allow for direct comparison of forecasts at both levels.
Planning for Change
The regional system addition was developed and introduced over the course of four months. Our customer took special care to ensure successful adoption by all stakeholders:
- Early in the development process, all the key participants were engaged to make sure their concerns were addressed. A testing phase allowed regional analysts to try out the system and provide additional feedback before the final rollout.
- To gain more visibility into regional thinking, corporate management asked regional analysts to provide forecast data for more years and for more brands than in previous years. To avoid overwhelming the regional users, the scope of products to be included in the system was reduced for the initial round.
- Acknowledging the increased demands on regional analysts by the new system, corporate recruited a special change management team, which provided ample guidance with data input when regional and corporate models needed alignment.
Due to careful planning and change management, the rollout was a success.
Something for Everyone
Incorporating Planview Advisor regional module into our customer’s existing corporate model made regional revenue forecasts comparable to those at the corporate level and provided advantages for all stakeholders in the process:
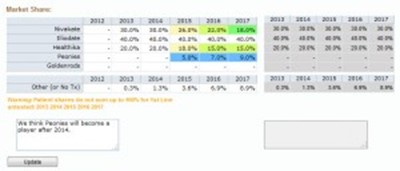
Analysts: As regional data is entered, the system displays regional and corporate inputs side-by-side. Deviation from corporate data is color–coded, providing easy comparison and locating areas of greatest divergence. Using the comment fields, corporate analysts could note assumptions, or the regional analyst could provide a rationale for notable deviations. With a single click, regional analysts could access forecast structure and corporate-level data (market segmentation, competitors, pricing and volume details, etc.), along with the assumptions behind the various numbers. Since regional analysts had greater access to the “big picture,” corporate analysts received fewer requests for additional information or clarifications. Finally, Planview Advisor’s linked model system freed both corporate and regional analysts from the drudgery of creating and maintaining separate Excel files and reports for each region, saving time and minimizing errors. Comparative reports and variance analysis could be generated on the fly or downloaded easily.
Management: Corporate decision-makers enjoyed better visibility into the forecasts. They could open any regional project and get a summary of the entire regional forecast model, along with the numbers, assumptions, and differences, in the same format and location in every project.
Company-wide: The whole company benefited from the system as the quality of conversations improved. There was visibility into market dynamics by country, and into differences between the regional analysts and the corporate analysts. This led to discussions of how to improve weak links in the delivery chain, and helped pinpoint where competitors were winning due to inadequate marketing efforts. This was a long way from prior years’ conversations when no one could align regional and corporate forecasts, and the provenance of the data was uncertain.
The system was so beneficial for the key regions that the other regions demanded it for their own forecasting. A follow-on engagement expanded the system to accommodate the specific needs of additional regions, allowing for a more complete global portfolio view.
The Best of Times with Planview Advisor
Our customer considered a traditional S&OP system for this application. However, none of those were appropriate for our customer, who required extensive market modeling and custom analytics tailor-made to their industry. The Planview Advisor provided a level of analytic power and flexibility that enabled us to meet our customer’s exacting modeling needs while providing all the reconciliation and roll-up capabilities necessary to make this global deployment a success..
Is your company facing similar challenges? If you would like to have a conversation about how to streamline forecast reconciliation workflow in your company, let’s talk!