
Note: This is an updated post (original publish date Aug. 29, 2018).
Wait, what? When is it bad to eliminate risks?
Between tariffs that threaten to eliminate your margins, regional conflicts that disrupt supply chains, and with the next economic downturn just around the corner, who in their right mind would want to embrace risk?
Many companies we speak with are keen to score their portfolio of initiatives across a number of dimensions, like:
- Strategic fit
- Market value
- Development cost
- Technical risk
- Commercial risk
So far, so good. The process goes awry when teams, seduced by the idea of simplicity, distill all the dimensions into a single score for each project.
High strategic fit and market value are “good” and increase the score, while high cost and risk are “bad” and reduce the score. And therein lies the problem.
This single-score approach will always reward low-cost, low-risk projects. The likely outcomes of prioritizing by this single score include:
- A low-risk or no-risk portfolio that includes only product line extensions and incremental product improvements
- A portfolio that funds late-stage partnerships that require minimal cash outlays and hold minimal risk but require high-royalty payouts and thus do little to increase company operating margins.
- A portfolio that deprioritizes early-stage and research initiatives that have higher risks and require longer-term investment but could yield significant returns over the long run.
- A company opts to buy back its public shares rather than increase investment in higher-risk initiatives (annual US corporate stock buybacks total more than a trillion dollars).
When companies value stability over innovation, some risks increase: they risk slowly losing market share and fading into the background of their industry. So what do we do? The solution lies in the understanding that effective R&D governance cannot, and should not, distill projects into a single number.
Read Next: Using Data Analytics to Navigate Tariff Impacts on Your Product Portfolio
5 Ways to Assess and Communicate Risk
The right number of high-risk projects in your portfolio is probably not zero. The exact number will depend on your corporate goals, risk tolerance, and financial reserves. Here are a few ways to assess and communicate risk in your portfolio.
Risk vs. reward
Rather than burying risk in an overall project score, construct a time-tested risk vs. reward chart to highlight the trade-offs (or lack thereof) between project risk and project value. Management may be surprised to see how many — or how few — risky projects populate the portfolio.
If your firm tends to be risk-averse, you might also consider recasting risk in the language of innovation. Rather than a risk score, assess technology readiness or initiative innovation levels.
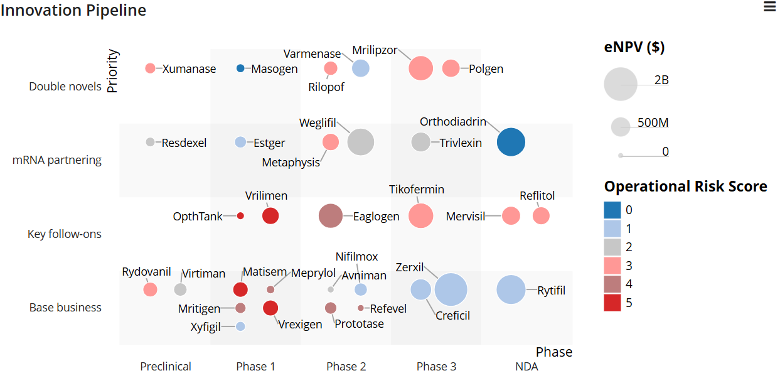
Project pipeline
You can also look at the balance of high- and low-risk initiatives in the portfolio. Are your high-risk projects concentrated in one division or market segment? Given the attrition you expect in your development lifecycle, is the balance of early- to late-stage initiatives appropriate? Are these allocations by design or happenstance?
A swimlane chart by strategic theme and lifecycle stage can reveal exactly where you’re investing in innovation, and where you’re avoiding risk at all costs. Place your lifecycle phases along the x-axis (horizontally) to make it easy to observe whether your pipeline is accounting for attrition: in most cases, you’ll want more initiatives in the earlier stages of development to improve your chances of at least a few crossing the finish line.
Portfolio revenue with uncertainty
Bubble charts are eye-catching, but they don’t address key questions of sufficiency: Do you have a sufficiently ambitious portfolio to meet your medium- and long-term goals? For that, you need to forecast project returns across the portfolio to understand how many high-risk, high-return initiatives must be funded to increase the chances of meeting portfolio goals.
With the right financial mechanics, you can forecast portfolio revenue while accounting for development attrition and commercial uncertainties. You may conclude that even if everything goes your way, reaching revenue goals is unlikely (an uncomfortable, yet important, realization).
Get Your Copy: How to Prioritize Your Product Portfolio When Disruption Happens
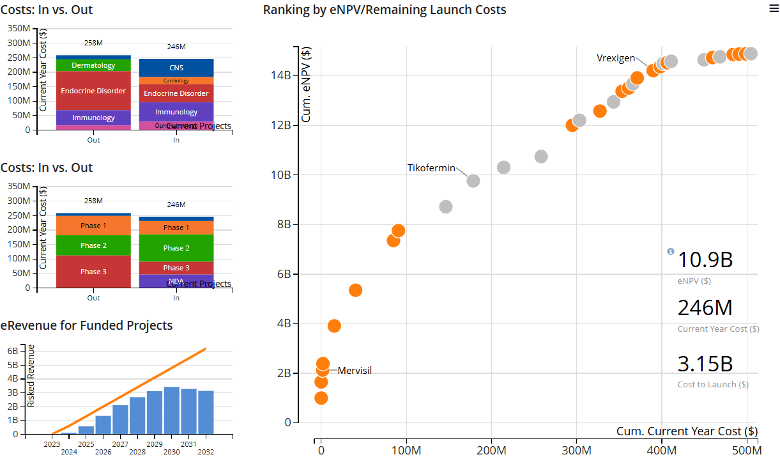
Balancing value and competing objectives
No company has just one strategic consideration; like a four-year-old with five “favorite” foods, your company needs to balance and eventually choose between a set of aspirations. You’ll want to fine-tune your innovation portfolio composition simultaneously across dimensions like strategic goals, markets, or technology platforms.
A prioritization dashboard will serve you nicely here, pairing those spend breakdowns with a revenue forecast and a productivity ranking of all initiatives. You’ll be able to hone your investment plan and observe the impact on your competing objectives in real time.
Operational risks
Finally, you can use charts like a flag chart to identify the mix of high- and low-risk projects in terms of upcoming milestones or reviews. Many charts can be improved by overlaying some aspect of project risk.
There are limits to your teams’ ability to manage and mitigate risks. If you have a glut of risky initiatives over the next quarter, consider spreading them out and mixing the risky and less risky activities to dilute the impacts of risky initiatives on your project and resource management processes.
Eyes Wide Open: Risks Ahead
By now, it’s clear I’m not suggesting we should ignore risks: It’s critically important to assess project risk across the portfolio. Risk assessment allows teams to identify the highest risks affecting the portfolio and focus their experience and talent on risk mitigation.
However, we need to differentiate between risks that should be mitigated (often with mitigation efforts that have a very high ROI) and risks that can only be resolved through the normal course of development.
The methods I’ve discussed above vary in sophistication, from Monte Carlo methods simulating thousands of financial outcomes for each project to simple project inventories, but they skew towards the simple rather than the complex.
Adding methodological sophistication isn’t always the solution: Brick and bar views are transparent, simple to explain, and are more likely to spur essential conversations about portfolio value and balance among your decision makers. Ultimately, those conversations will be more important than the sophistication of the analytic methods you employ.
How do you measure and account for risk in your product portfolio? Does your organization recognize and fund more innovative, less-certain initiatives to ensure a long-term future?
More to Explore with Planview Advisor
Connect strategy and performance to optimize your return on investment during even the most uncertain times with Planview Advisor.
- Quickly see the impact of tariffs on products and profitability. Watch Demo
- Make uncertainty your competitive advantage. Take a Product Tour