
You’re Agile. You have the ceremonies in place, you’ve got planning down – and as you move through each increment you discover the need to tweak processes and implement continuous improvement practices. Effective Agile Program Management means having the right Agile metrics to measure team progress, performance, and overall health.
We recently hosted a series of virtual discussions complete with demos that outline how establishing Agile Program Management can help business spearhead some of the top challenges with scaling Agile.
In this four-part blog series, I share highlights from each discussion offering ways to improve your approach to scaling Agile.
This blog is dedicated to “Part 3: Lean and Agile Metrics – Oh My” and focuses on how Agile Program Management software can help organizations visualize work and data, manage WIP limits, size features, evaluate velocity, and measure burndown at the program and team level.
If you are interested in this topic, here’s quick access to the full Agile Program Management 4-Part discussion and demo series.
Why do Agile Metrics matter?
Agile metrics are a way to promote team feedback to measure and improve the Agile processes –from the way ceremonies are conducted to how teams deliver work.
The four areas of Agile Metrics include:
- Productivity and throughput
- Predictability and stability
- Responsiveness and time in process
- Quality and defect density
Lean and Agile metrics include but are not limited to: Delivery metrics, such as release frequency and delivery speed, velocity, sprint burndown, epic and release burnup, cycle time/lead time, cumulative flow, and epic and release burndown. For an expanded explanation, check out the article Agile Metrics vs. Lean Metrics.
Agile Program Management and Planview AgilePlace
As discussed in the previous blogs, you need an enterprise Kanban solution like Planview AgilePlace to set-up team-level boards (for teams of teams or Agile Release Trains) and then roll up the information in team boards to a single program-level view. Not only does it allow you to manage and visualize work, conduct ceremonies such as PI planning, but you also get access to the Lean and Agile metrics to start conversations, identify risks, and improve processes.
Out of the Box Metrics in Planview AgilePlace
Each Kanban board in Planview AgilePlace comes with “Current State” metrics which helps you answer questions such as:
- Assigned Users: How many users are assigned current work?
- Distribution: What type of work are we working on?
- Exceptions: What work items have missed their planned start and/or finish date?
- Timeline: Where are we with scheduled work items? And what’s at risk?
In addition to current state metrics, you can also view “Historical Trends” which helps you answer questions like:
- Burndown: Are we on track to complete the planned work by the deadline/end of this iteration/sprint?
- Efficiency: What number of active cards and inactive cards are in process for a specific date as well as work in progress.
- Cumulative flow: What work is in progress as it flows through the Kanban system?
- Planned Percent Complete: What work is completed by the planned finished date vs the actual finish date?
- Speed: What’s the average amount of time that a card takes to be processed from a specified start lane(s) to a specified finish lane. Are we on track to finish our work for a given program increment?
All these metrics in Planview AgilePlace enable teams to have conversations at the team level and the program level. Below I will share one of my favorite team reports and dive into why connecting team boards is critical to program level reporting.
Exceptions Report – A Valuable Report for Any Team
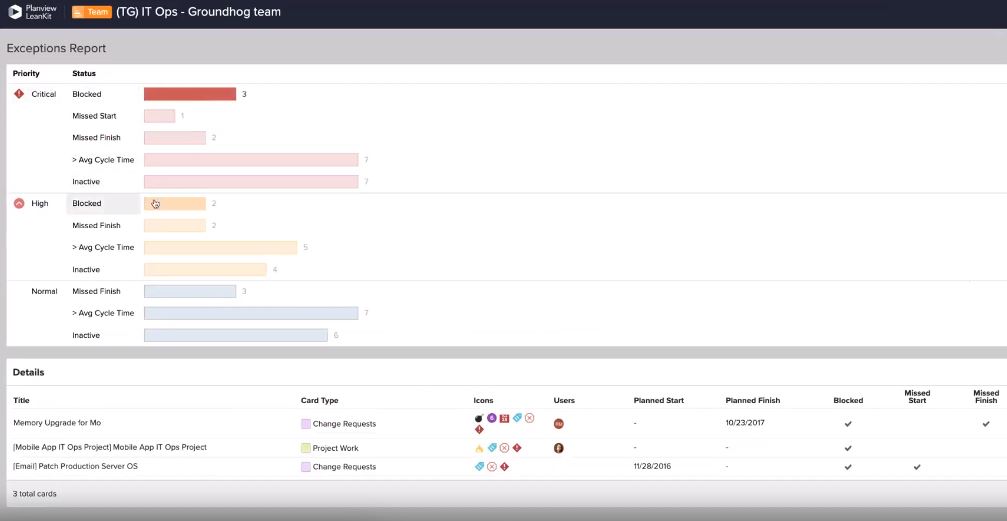
The exceptions report provides excellent insight for the entire team – but also the Scrum Master, as their job is to remove blockers and escalate risks to improve team performance. The report allows team members to quickly identify risks to cards currently in flight. The report offers a stack ranked view by “risk severity” so you can see highest risk first and act accordingly.
Visualize risks by:
- Missed start date
- Missed finished date
- Inactivity
- Speed
Then you can go a step further by drilling into the card itself and begin a discussion based on information featured in the history and health section to collaborate, make decisions, prioritize or course correct as needed.
Out-of-the-Box Reports + the ability to create Custom Reports at the Program Level
From the program board, leaders can visualize and track progress of teams of teams work – an extremely powerful capability in Planview AgilePlace. At the program level, leaders get access to the exact same out-of-the box Agile metrics and reports mentioned above, but from a team of teams perspective. For example, at the program level you can visualize how features are moving through Team X’s, Team Y’s, and Team Z’s processes, as well as visualize the health and history of each to make important data driven business decisions and view the exceptions report to evaluate risks across the ART.
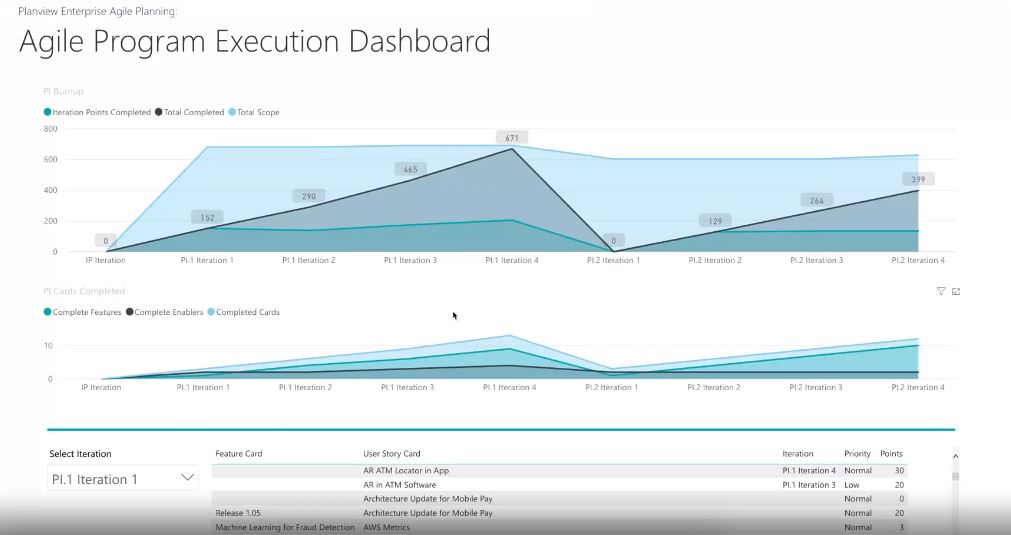
In addition, you can also create custom reports leveraging the data connected from multiple team-level boards for metrics unique to your organization. As an example, during the demo the team provided an example of a custom report titled “Agile Program Execution” that features information across multiple team boards across multiple program increments and displaying interactions points, total completed cards, total scope as well as completed features and completed enablers. This is just one example of how connecting multiple team boards to a program board can enable powerful reporting at the program level and how leadership can advance their Agile program and promote continuous improvement.
451 Research Video: Agile Program Management
For expert advice about Agile Program Management, watch Chris Marsh, principal analyst from 451 Research provides insights about the benefits, best practices and supporting technology.

Stay tuned to the Planview blog as we dive into the final demo discussion, Agile Program Management – Eating the Cake, too! As the team discusses the benefit of implementing an Agile Program Management solution.

![Agile Program Management: How to Increase Agile Scaling Success [Video]](https://blog.planview.com/wp-content/uploads/2020/09/Apm-video.gif)